
Manage your listing
Follow a step-by-step guide with online chat support to create or manage your listing.
Community


Let’s talk

Dana Stanley
Greenbook’s Chief Revenue Officer
Categories
Research Methodologies
February 19, 2019
Rotate Your Correspondence Analysis to Better Understand Your Brand Positioning
Tim Bock on utilizing correspondence analysis.
by Tim Bock
0
Correspondence analysis is perhaps the most widely used multivariate tool in market research. It’s our “go to” tool for displaying complex tables, such as brand association tables. A practical challenge with correspondence analysis is that it is designed to best show all of the relationships in the data, but sometimes we are more interested in one particular brand. That is, we want to focus our attention on finding insights that relate to our (or our client’s) brand. This can be achieved by rotating the correspondence analysis.
Case Study: Carbonated Soft Drinks
The visualization below shows the map created by a correspondence analysis of a segment of the Australian carbonated soft drink market. In the top-right we have the highly caffeinated energy drinks, all clustered together and owning energy-related attributes. Fanta appears in the top left, being for Kids and Fun, while Coke, Pepsi and Lift sit near the middle. When a brand sits near the middle of a map it means that the map isn’t doing a great job at describing what makes it unique.
As far as maps go, this one is pretty good. It explains 77.5% + 17% = 95% of the variance that can be shown by a two dimensional correspondence analysis. Usually in data analysis 95% is pretty good. But, we’re interested in finding out what has been lost. Are there any interesting insights hiding in the missing 5%?
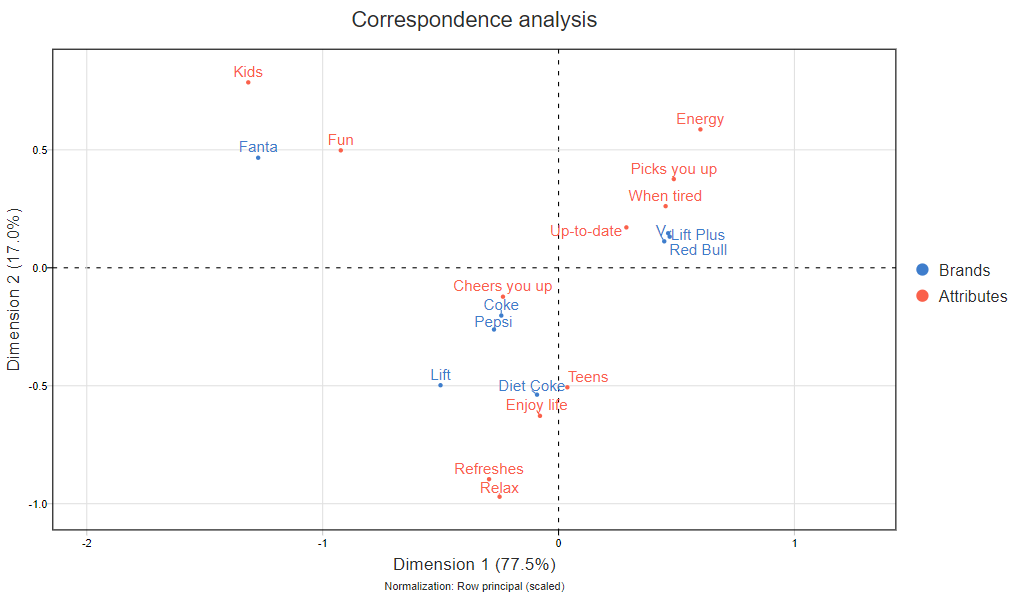
When doing a correspondence analysis, it is possible to compute the quality of the map for each of the individual points. In this case study, we’re interested in brand. If we compute the quality (which is a standard output in nearly all correspondence analysis software), it shows that, in increasing order, the quality is 68% for Lift, 69% for Pepsi, 78% for Diet Coke, 87% for Coke, and 99%+ for the other brands. Note that the overall map quality of 95% is not the average of the individual quality scores. Correspondence analysis focuses on the brands with the strongest relationships, and these stronger relationships make up the lion’s share of the 95% value.
Imagine that you were the brand manager for Lift. Looking at the map, we can see it seems to be a bit like a Cola. It is as different to Coke as is Diet Coke. And, it seems to be associated with the attributes Refresh and Relax, although it is a bit hard to be sure given the quality scores. (If you are new to correspondence analysis, please read How to Interpret Correspondence Analysis Plots (It Probably Isn’t the Way You Think) for more detail on how to correctly interpret such a map).
Rotating the Correspondence Analysis
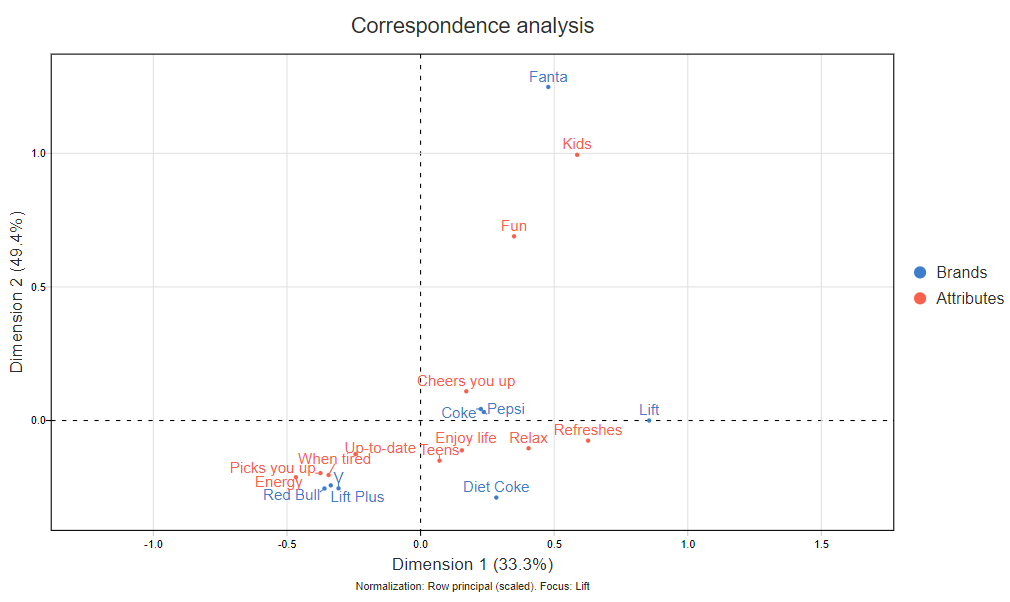
Just like with factor analysis and principal components analysis, it is possible to rotate a correspondence analysis to make patterns in the data easier to see. In the map below, I’ve rotated the correspondence analysis so that it gives a 100% quality score for Lift. (The math is a bit complex, but you can find the equations here.)
The resulting map (displayed below) now shows 83% of the variance, so it is not as accurate overall as the earlier map. This is not a surprise. The standard correspondence analysis without rotation maximizes the variance overall. In making the map focus on Lift, we have implicitly accepted that we are willing to sacrifice overall accuracy in return for getting a better read on Lift’s position.
Note that the broad features of this map are the same. The high-caffeinated brands are still grouped together, as are the colas, and Fanta is off on its own. However, the conclusions have changed for Lift. We can now see that Lift is much more on its own than implied by the previous map. And, we can see that it is relatively strongly associated with Refreshes, and only modestly with Relax.
Doing it Yourself
Rotating correspondence analysis to focus on a particular brand is a new technique. Our paper describing how it works has only just been published. However, if you want to do it yourself, there are some easier solutions than reading the paper. If you know how to use R, we’ve open-sourced all the calculations here. You can also do it for free in Displayr. And, you can do it in Q as well. Please reach out to me if you need any help.
Disclaimer
The views, opinions, data, and methodologies expressed above are those of the contributor(s) and do not necessarily reflect or represent the official policies, positions, or beliefs of Greenbook.
Comments
Comments are moderated to ensure respect towards the author and to prevent spam or self-promotion. Your comment may be edited, rejected, or approved based on these criteria. By commenting, you accept these terms and take responsibility for your contributions.
More from Tim Bock
Research Methodologies
Data Visualization for Conjoint Analysis
Visualizations can summarize patterns that are commonly hidden in a simulator
Tim Bock
What’s Better Than Two Pie Charts?
Bad visuals stress the need for charts to be interpretable in seconds
Tim Bock
Insights Industry News
Using “Small Multiples” Visualizations for Big Success
Visualizing data can be made easier by utilizing small charts for comparison and analysis
Tim Bock
Insights Industry News
Replacing Boxplots and Histograms, with Rugs, Violins & Bean Plots
Visualizations guide for comparing the distributions of numeric data.
Tim Bock
ARTICLES
Top in Quantitative Research
Research Methodologies
Moving Away from a Narcissistic Market Research Model
Why are we still measuring brand loyalty? It isn’t something that naturally comes up with consumers, who rarely think about brand first, if at all. Ma...
Devora Rogers
Chief Strategy Officer at Alter Agents
Qualitative Research
The Stepping Stones of Innovation: Navigating Failure and Empathy with Carol Fitzgerald
Natalie Pusch
Senior Content Producer at Greenbook
Sign Up for
Updates
Get content that matters, written by top insights industry experts, delivered right to your inbox.
67k+ subscribers