
Manage your listing
Follow a step-by-step guide with online chat support to create or manage your listing.
Community


Let’s talk

Dana Stanley
Greenbook’s Chief Revenue Officer
Categories
January 8, 2019
GRIT “Sneak Peek”: Adoption of Emerging Methods
The use of emerging methods seem mostly stable with past years, with buyers using non-survey methods more than providers.
by Ray Poynter
0
Editor’s Note: The release of a new GRIT Report is always a major industry event, and the major report on Q3-Q4 2018 results is scheduled to be released mid-January. In anticipation of the detailed findings, we thought we’d provide “sneak peeks” into several of the major sections. We have three such sneak peeks scheduled for the Blog this week. Today, we have the second one, an overview of Emerging Methods, written by Ray Poynter. For me personally, it is worrisome that we continue to see the same trend that research providers significantly lag research buyers when it comes to using growing, non-survey methods. Friends, the competitive frame is continuing to widen.
In looking at what research approaches/methods are in use or under consideration, it is important to remember that the GRIT sample is not a representative sample of the market research population. The GRIT sample tends to be drawn from those more engaged with the future of research, so the ‘in use’ figures will tend to be higher than for the wider market research population. The GRIT report’s key usefulness lies in the relativities between the approaches, the trends over time, and the differences between key groups (such as the buyers and sellers of research/insight).
The 2018 questionnaire (in terms of emerging technologies) is the same as the 2017 version. Before 2017 the term Mobile Surveys was used, and this had reached the point where 75% of participants said they were using Mobile Surveys. So, from 2017 we have used the term ‘Mobile First Surveys’ and this has, not surprisingly, reduced the ‘In Use’ figure, to 50% for the Total sample in 2017 and 54% in 2018.
The Overall Picture
Table 1 shows the 21 approaches included in the GRIT study ranked in terms of how many people said they were already using these techniques. Remember, ‘using a technique’ does not necessarily means using it heavily, it may mean it is sometimes used, and sometimes not.
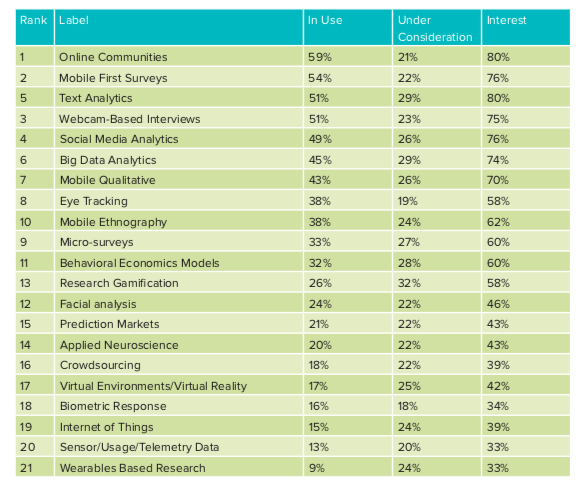
As in 2017, Online Communities top the list with 59% saying they are In Use, and a further 21% listing them as Under Consideration, giving a total Interest score of 80%. Just behind Online Communities there are a group of four techniques that are perhaps (along with Online Communities) the new mainstream (or the mainstream of the new). These four are: Mobile First Surveys (54% In Use, 76% Interest), Text Analytics (51%, 80%), Webcam-based Interviews (51%, 75%), and Social Media Analytics (49%, 76%).
The remaining 16 items can be divided into three groups, Strong Niche, Middle Niche and Small Niche. The Strong Niche ranges from Behavioral Economics Models (32% In Use) to Big Data Analytics (45% In Use). These items are in widespread, but not mainstream use.
The Middle Niche runs from Applied Neuroscience (20% In Use) to Research Gamification (26% In Use). This group tends to be the provenance of specialized agencies and researchers.
The Small Niche ranges from Wearables Based Research (9% In Use) to Crowdsourcing (18% In Use). These approaches are by any measure small and not in widespread use.
Stability with Some Increases
Table 2 shows the ‘In Use’ data from August 2014 to November 2018, a period of four years. The data shows that there are changes, but only a few of them are big enough to catch the eye. Given the nature of the data, sampling variation etc, we tend to ignore anything smaller than plus or minus 5%.

The main increases amongst the more mainstream approaches are: Big Data Analytics (+7%), Social Media Analytics (+6%), and Text Analytics (+5%). All three of these share the characteristic of focusing on non-survey data – an area that other studies suggest is the main driver of growth in market research and insights. The only other approach that showed a shift of more than 5% was Virtual Reality, which is perhaps a combination of an increase and a correction, since the 2018 estimate of 17% was also the score in 2014.
Most of the approaches that are in the group we described as the Small Niche do not appear to be showing any sign of expanding beyond their small group of users.
We also checked the open-ended suggestions for emerging techniques that were not part of the existing survey. The most common responses were Chatbots and Machine Learning.
Buyers and Suppliers
Table 3 shows the ‘In Use’ data for Buyers and Suppliers of market research, and the right-hand column contrasts the results.

The pattern of techniques and approaches in use is similar between Buyers and Sellers (not surprisingly) with an r-squared value of 83%. However, there are some interesting differences.
In several of the technical areas of research the percentage of suppliers using them is higher than the buyers, for example: Research Gamification (Suppliers 29%, Buyers 17%), Mobile Qualitative (Suppliers 46%, Buyers 35%), and Mobile First Surveys (Suppliers 56%, Buyers 48%).
However, the more interesting cases are those where the Buyers are more likely to be using an approach than the Suppliers. The two key ones being: Social Media Analytics (Buyers 63%, Suppliers 45%) and Big Data Analytics (Buyers 55%, Suppliers 41%). This finding is consistent with earlier waves of GRIT and we believe it indicates that for these two services many clients are buying from non-MR suppliers.
The Big Picture
The main message is that over the last four years things have been relatively stable, The stability message is of particular interest to those championing the exciting approaches that have yet to take off, for example Biometrics, Wearables, IoT and Neuromarketing. When and if we see these techniques becoming more mainstream, we will see them moving up the GRIT league table – but there is no sign of that yet.
If you are running a middle-sized organization then the data suggest that unless you are an outlier, you should be using Mobile First Surveys and Online Communities, some of the techniques in the middle of the table, and perhaps one of the emergent techniques in the bottom group.
The main worry for market research providers is the suggestion from the data that many research buyers are turning to non-market research sources for their Big Data and Social Media Analytics – something the GRIT report has been showing for some time now.
Disclaimer
The views, opinions, data, and methodologies expressed above are those of the contributor(s) and do not necessarily reflect or represent the official policies, positions, or beliefs of Greenbook.
Comments
Comments are moderated to ensure respect towards the author and to prevent spam or self-promotion. Your comment may be edited, rejected, or approved based on these criteria. By commenting, you accept these terms and take responsibility for your contributions.
More from Ray Poynter

The Future Place
Word Cloud Plus Extracts Hot Buzz Topics
The GRIT data collected toward the end of 2022 included 918 open-ended replies to the question “Related to insights, research, or analytics, which topics do you follow most closely and…
By Ray Poynter
Research Methodologies
Observational Data Has Problems. Are Researchers Aware of Them?
Observational data is a tempting shortcut for insights but researchers must consider its potential shortfalls
Ray Poynter
Managing Director at The Future Place
Business-to-Business (B2B) Market Research
Want it Faster, Cheaper, Better? Then You’d Better Sign Up to Prescriptive Analytics
Using Prescriptive Analytics to navigate the data-filled world.
Ray Poynter
Managing Director at The Future Place
Company Size Matters: The Differential Impact of COVID-19
A deep dive into the very different experiences of the MRX community during COVID-19.
Ray Poynter
Managing Director at The Future Place
ARTICLES
Top in Quantitative Research
Research Methodologies
Moving Away from a Narcissistic Market Research Model
Why are we still measuring brand loyalty? It isn’t something that naturally comes up with consumers, who rarely think about brand first, if at all. Ma...
Devora Rogers
Chief Strategy Officer at Alter Agents
Qualitative Research
The Stepping Stones of Innovation: Navigating Failure and Empathy with Carol Fitzgerald
Natalie Pusch
Senior Content Producer at Greenbook
Sign Up for
Updates
Get content that matters, written by top insights industry experts, delivered right to your inbox.
67k+ subscribers