
Manage your listing
Follow a step-by-step guide with online chat support to create or manage your listing.
Community


Let’s talk

Dana Stanley
Greenbook’s Chief Revenue Officer
Categories
June 2, 2017
GRIT Sneak Peek: Adoption and Consideration of Automation Platforms
From the forthcoming GRIT Report, Ray Poynter analyzes the adoption and consideration of automation solutions within the insights industry.
by Ray Poynter
0
Editor’s Note: The Q1-Q2 2017 GRIT Report will be released next week, and as usual it is chock full of good stuff! One of the specific areas we have tracked now for the second time is the adoption and interest in automation approaches in the insights industry. In this sneak peek from the report Ray Poynter dives into the data and provides his take on what it says and what it means for our industry. We hope you enjoy this as an “appetizer” before the whole report comes out next week!
Automation continues to be one of the key topics of conversation in market research. In 2016, we explored the adoption of automation platforms. We found that in many areas of market research, such as ‘Analysis of survey data’ and ‘Charting and infographics’, automation was already in widespread use. We have returned to this topic this year, with a slightly modified questionnaire, to take a better look at automation and the changes it embodies.
The big picture is that many organizations have adopted automation platforms, and this is especially true in the area of quantitative research. This widespread adoption is illustrated in the chart below. The dark green sections show where automation platforms are in use, and the light green shows where they are being explored or piloted.
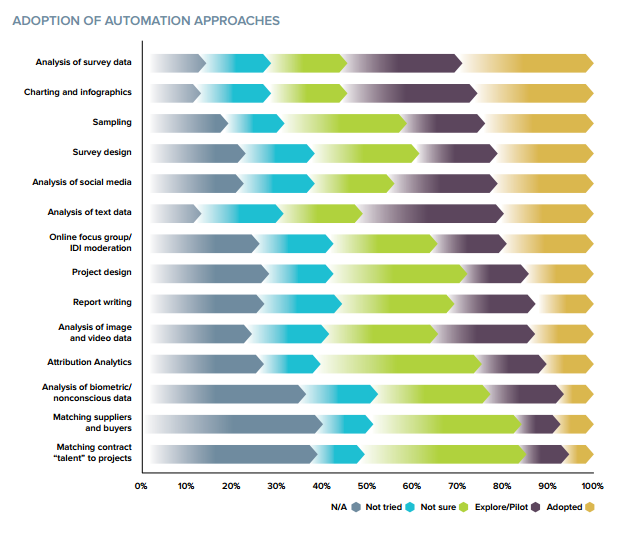
As with 2016, there is evidence that large numbers of organizations are utilizing automation, and that many others are exploring / piloting the use of platforms. In terms of adoption, the top four categories are all quantitative – an area where automation has a long history.
The next two categories (analyzing social media and analyzing text data) both represent an area where researchers would like to tackle data that has traditionally been handled qualitatively in a more quantitative way.
If you run your eye down the chart and look at the shape of the combined green sections (i.e. Adopted and Explore/Pilot), you will see two breaks in the general pattern of the data. These two breaks are: Analysis of Text Data and, to a lesser extent, Analysis of Images/Videos. These two categories have more people exploring/piloting them than would be expected by their position in the table. These two are clearly high priorities for automation.
There is a large amount of mirror symmetry between the adoption rate and the number of people who said that this type of work was not applicable to their organization. Visually this refers to the dark green section (Adoption) and the grey section (Not applicable to my organization).
On average, the sum of Not Applicable and Adopted is close to 42%, with most categories only varying up or down by a few percentage points. For example, the bottom three categories in the list (matching contracts and analyzing biometric/nonconscious data) have combined Not Applicable and Adopted totals of 45%, 46%, & 43%. The top three categories in the list (survey analysis, charting & sampling) have combined totals of 43%, 39%, and 43%.
The data suggests that, at the moment, the key driver of automation adoption has been the number of people who see the category as applicable to their organization. Presumably, money and time has been invested most in those tasks that most people have to tackle, leading to this mirror symmetry between Adopted and Not Applicable.
Comparison with 2016
Using the learnings from 2016, we have redesigned the questionnaire to distinguish between people who do a task but have not automated it, and those who have not automated a task because they do not do it. For example, if you do not conduct surveys (because you are entirely qual) you won’t be using automation for survey data analysis. This means the individual scores from this year are not directly comparable with the data from 2016.
However, we did review the changes between the two years and the results suggest that little has changed over the last year. In terms of ranking, the top two were the same, the bottom item was the same, and nothing moved by more than two places. In terms of the raw scores, the r-squared between the two years was 95% – confirming that little had changed in the last year, other than the specific values generated by the questionnaire change.
Role of game-changing automation
The chart shows that the key driver, in terms of adoption of automation platforms, has been how many organizations need to address a specific category. But, the challenge for people automating market research is to create situations where automation leads to a change in the way research is done.
A good example of the potential to create a game-changing situation is the matching of talent with projects. At present only 6% of organizations say they are using automation for this task, and only 10% are investigating it. A whopping 38% say it is not applicable to their organization. If the new platforms that are coming on-stream in this area are to be truly disruptive, they not only need to grow the adoption rate, they will need to reduce the number stating Not Applicable.
Adoption and consideration: clients vs. suppliers
As the chart below shows, the overall pattern of adoption of automation between clients and suppliers is similar.

However, the chart does show a few interesting differences, and these are consistent with 2016. Suppliers are slightly more likely to have adopted (or be actively exploring) the top four (mostly quantitative) categories – especially sampling and survey design. Clients are much more likely to be using automation for Analysis of Social Media, which is consistent with 2016 and consistent with other GRIT findings that the proportion of clients researching via social media is higher than the number of agencies offering this service.
Who is automating more / less?
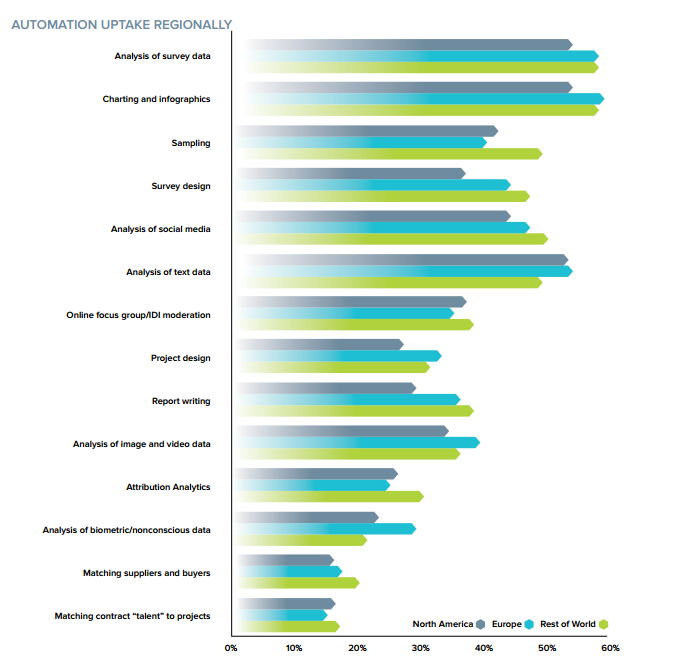
The two standard analyses that GRIT runs as a starting point with GRIT data are to compare clients and suppliers, and to compare the regions against each other. The previous section looks at clients and suppliers, but the analysis of regions found very few differences, and none that were large. The “Rest of the World” tend to be slightly more likely to use automation platforms compared to Europe and North America, but the differences are modest
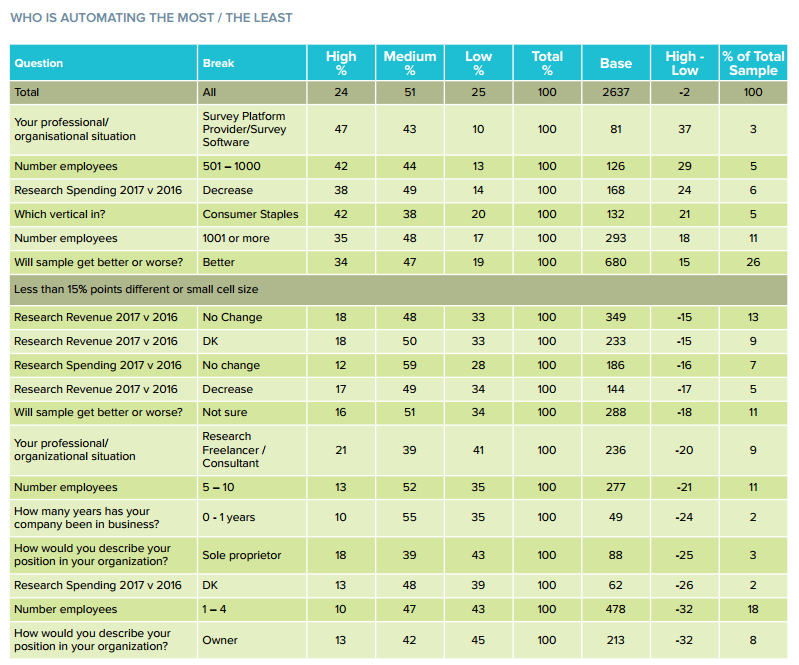
Since analysis by region does not show differences, and the client versus supplier analysis only showed modest differences, we decided to dig deeper. We divided the sample into the 25% who said they were Automating the most, the 25% who said they were doing it the least and the 50% who were in the middle. This was done on the basis of the five point rating scales across all 14 categories.
This analysis enabled us to identify the sorts of organizations who were automating most and those were automating the least. These differences are described below.
Who is automating the most?
- The survey platforms and survey software companies
- Companies with more than 500 employees
- Clients who will be spending less in 2017 than 2016
- Clients in the Consumer Staples category
- Companies who think sample quality will improve
Who is automating the least?
- Small companies (10 or fewer people), companies formed in the last year, sole traders, freelancers, and people who own the company
- Clients who think their research spending in 2017 will be the same as 2016 (and those who said Don’t Know)
- Suppliers who said their research revenues in 2017 would Fall, Stay the Same, or answered Don’t Know.
The big picture
Automation is here to stay and many organizations are implementing a wide range of automation projects. The three key groups driving this process at the moment appear to be:
- Companies who believe the future is automated (e.g. sample will get better, surveys will be automated) etc.
- Clients looking to get more results and spend less money.
- Suppliers who are growing (and tend to be larger)
However, the data suggest that many other groups are missing an opportunity to expand their capacity. Even if your research budget is not threatened, why not make it go further? If your research revenues are unclear or falling, surely you need to protect you margins by reducing costs? And, automation can allow small companies to tackle projects that in the past only large clients could tackle.
Disclaimer
The views, opinions, data, and methodologies expressed above are those of the contributor(s) and do not necessarily reflect or represent the official policies, positions, or beliefs of Greenbook.
Comments
Comments are moderated to ensure respect towards the author and to prevent spam or self-promotion. Your comment may be edited, rejected, or approved based on these criteria. By commenting, you accept these terms and take responsibility for your contributions.
More from Ray Poynter

The Future Place
Word Cloud Plus Extracts Hot Buzz Topics
The GRIT data collected toward the end of 2022 included 918 open-ended replies to the question “Related to insights, research, or analytics, which topics do you follow most closely and…
By Ray Poynter
Research Methodologies
Observational Data Has Problems. Are Researchers Aware of Them?
Observational data is a tempting shortcut for insights but researchers must consider its potential shortfalls
Ray Poynter
Managing Director at The Future Place
Business-to-Business (B2B) Market Research
Want it Faster, Cheaper, Better? Then You’d Better Sign Up to Prescriptive Analytics
Using Prescriptive Analytics to navigate the data-filled world.
Ray Poynter
Managing Director at The Future Place
Company Size Matters: The Differential Impact of COVID-19
A deep dive into the very different experiences of the MRX community during COVID-19.
Ray Poynter
Managing Director at The Future Place
ARTICLES
Top in Quantitative Research
Research Methodologies
Moving Away from a Narcissistic Market Research Model
Why are we still measuring brand loyalty? It isn’t something that naturally comes up with consumers, who rarely think about brand first, if at all. Ma...
Devora Rogers
Chief Strategy Officer at Alter Agents
Qualitative Research
The Stepping Stones of Innovation: Navigating Failure and Empathy with Carol Fitzgerald
Natalie Pusch
Senior Content Producer at Greenbook
Sign Up for
Updates
Get content that matters, written by top insights industry experts, delivered right to your inbox.
67k+ subscribers